
 clients' login
MonarchCharts for Java
 MonarchCharts for Java is our components library for creating charts which aids your decision making process.
Product gallery


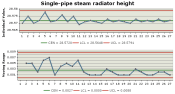


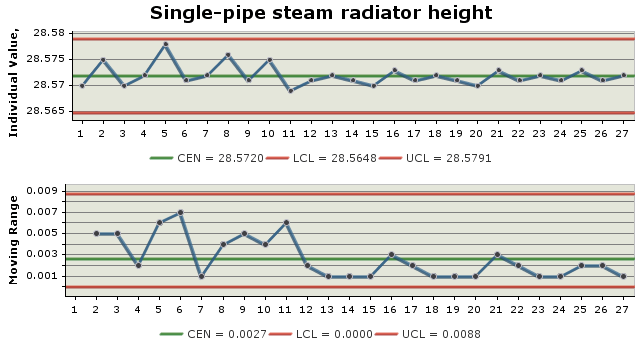


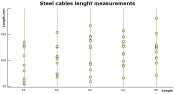
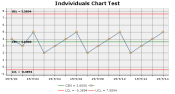
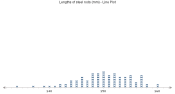
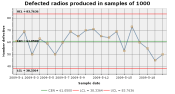
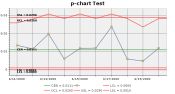
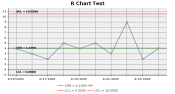
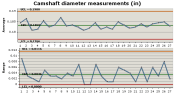
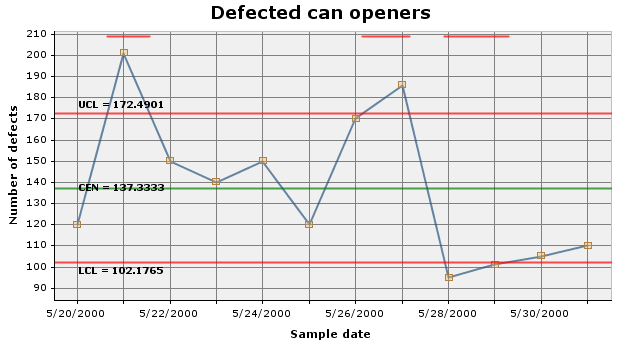
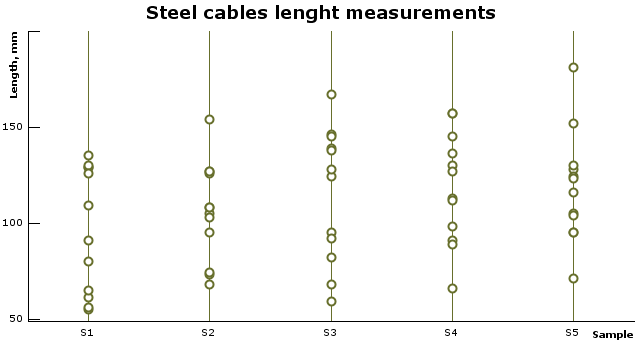
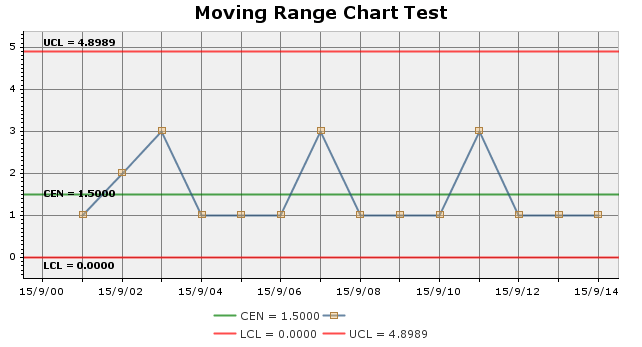
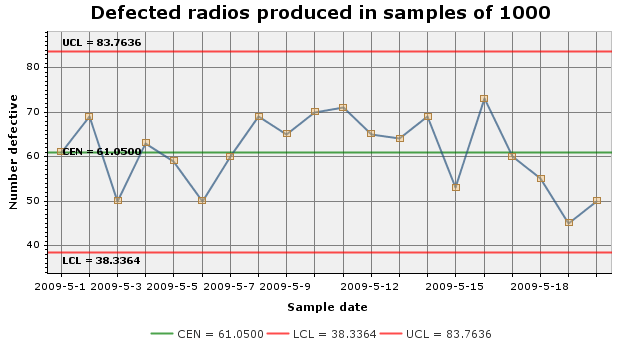
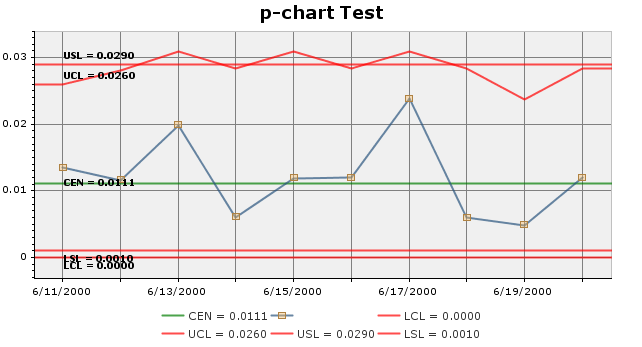
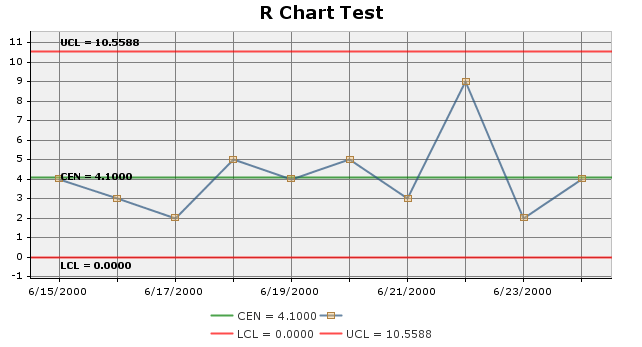
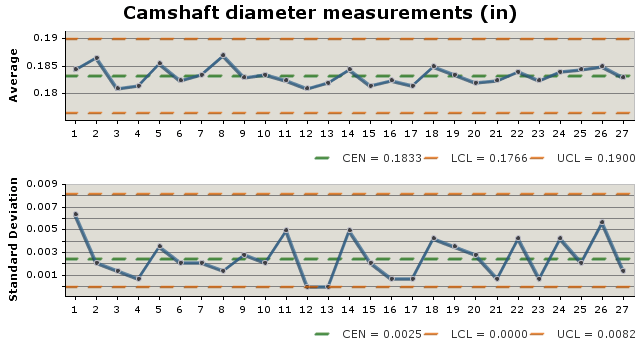
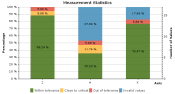
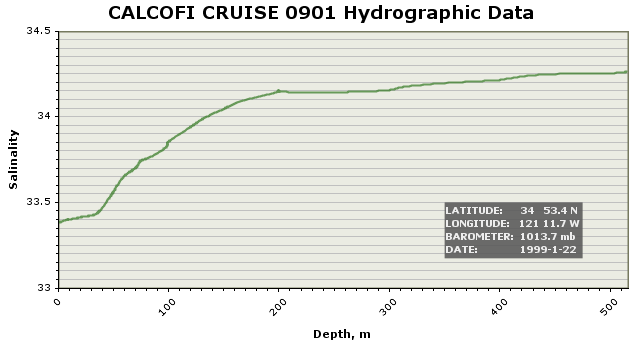
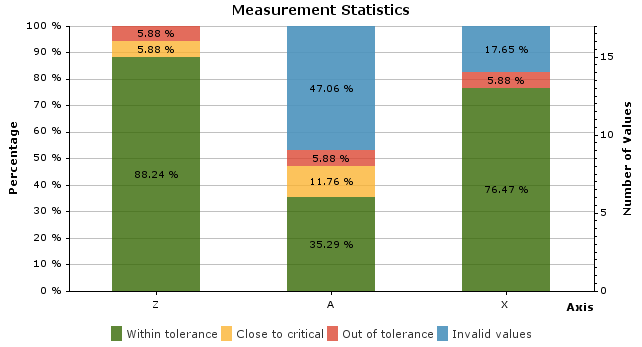
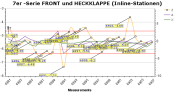
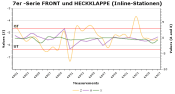
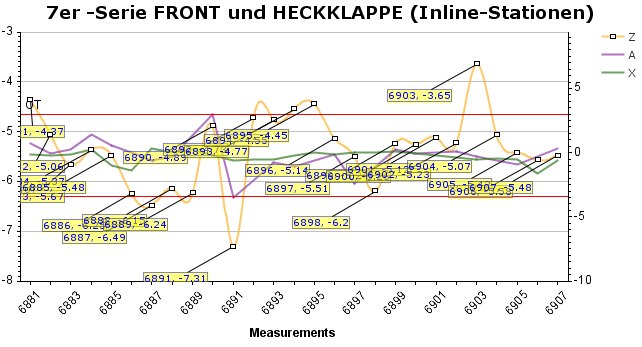
When it comes to measurements display, MonarchCharts treats data with precision. Statistical Process Control charts will make your process adjustment decisions easy.
Want to compare results?
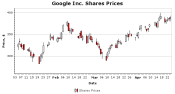
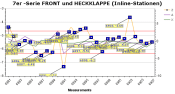
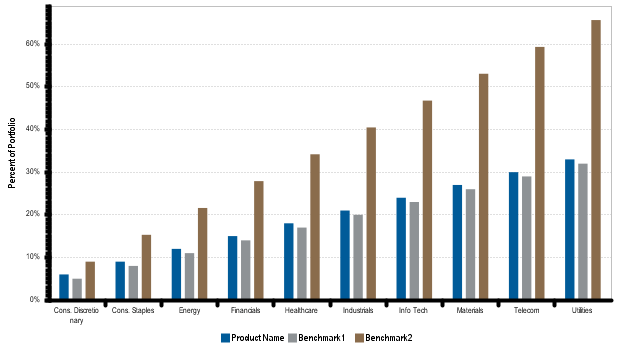
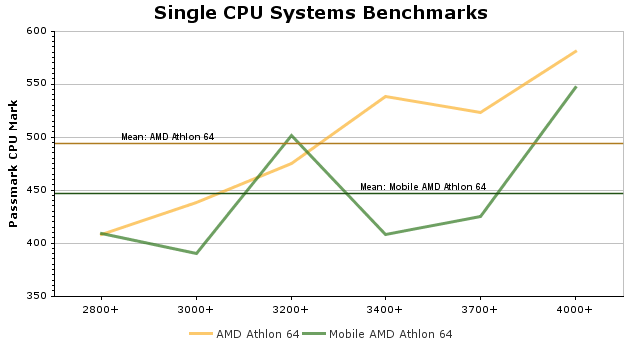
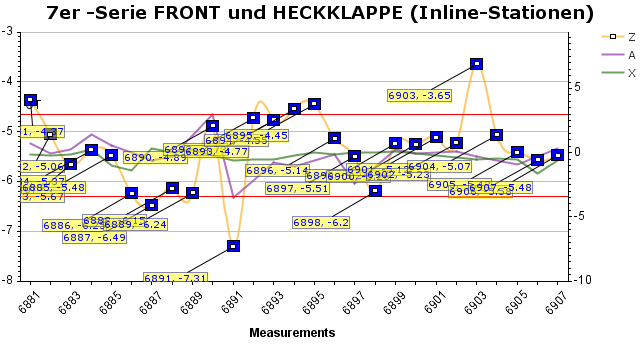
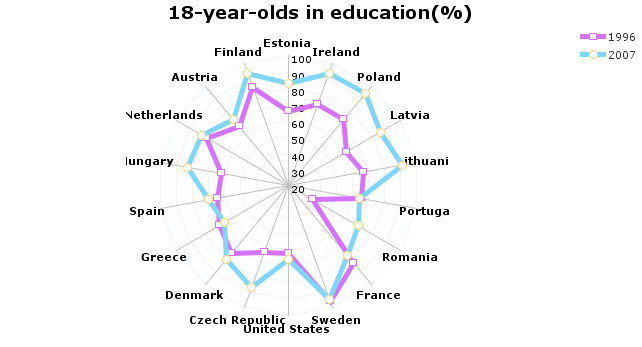
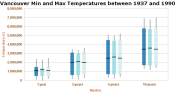
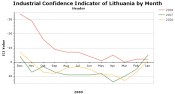
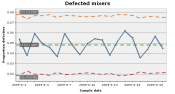
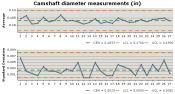
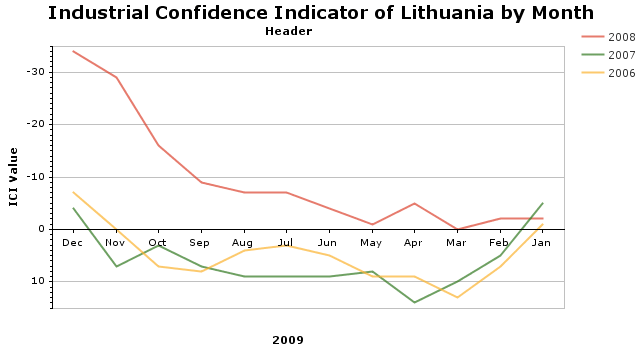
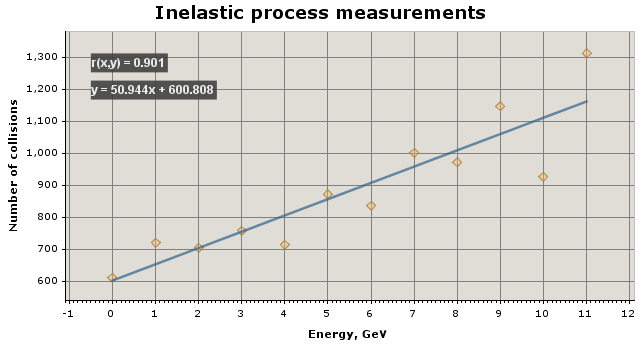
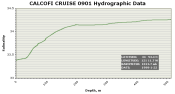
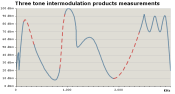
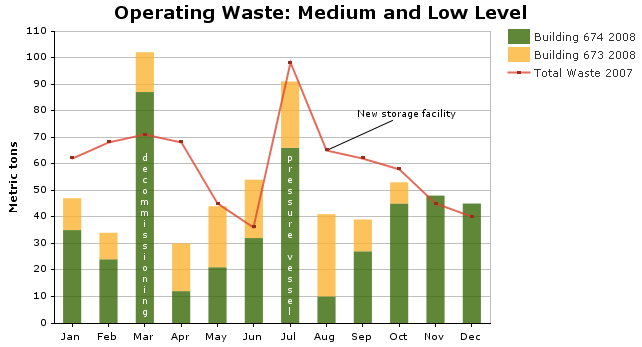
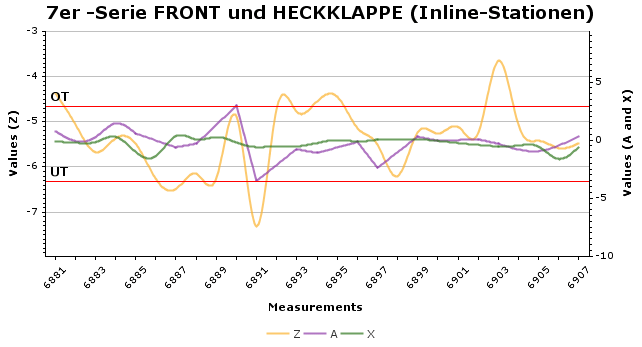
Performance is measured by comparing. MonarchCharts can display several data sources on the same chart for a neat distinct visual inspection.Are your numbers right?
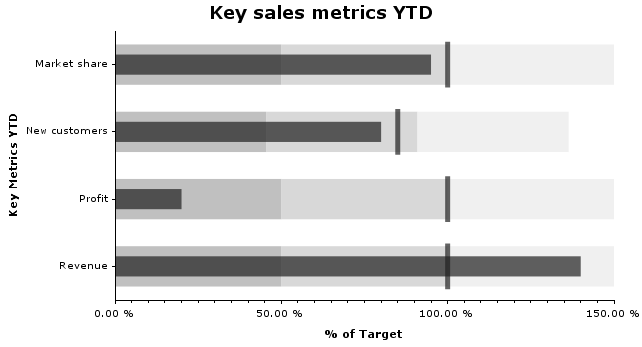
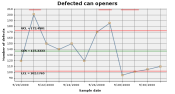
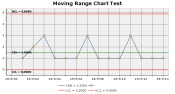
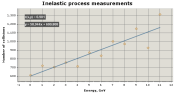
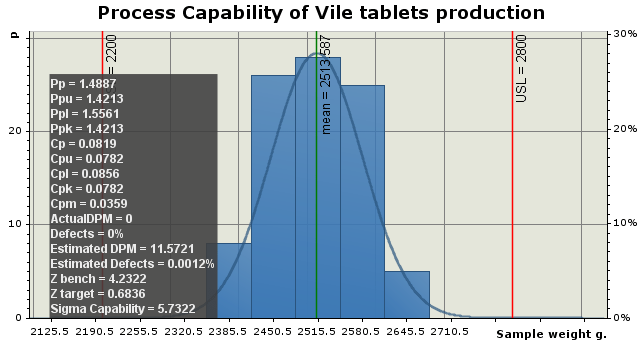
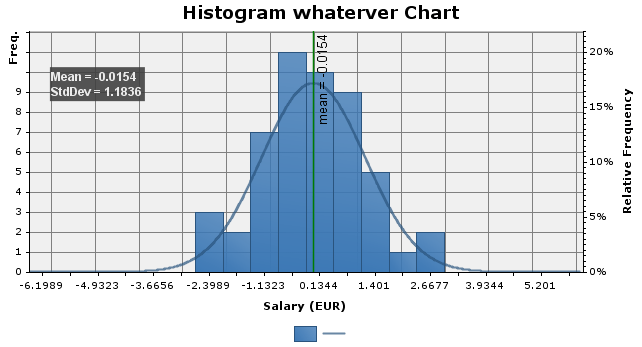
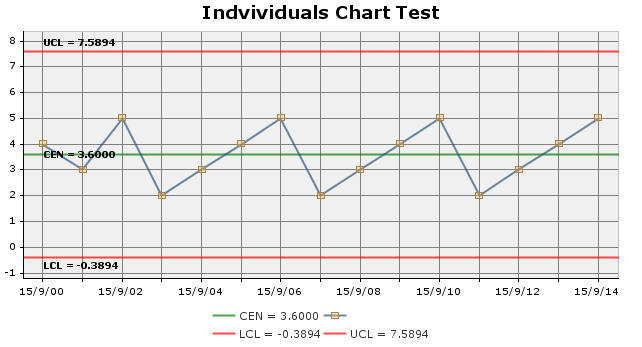
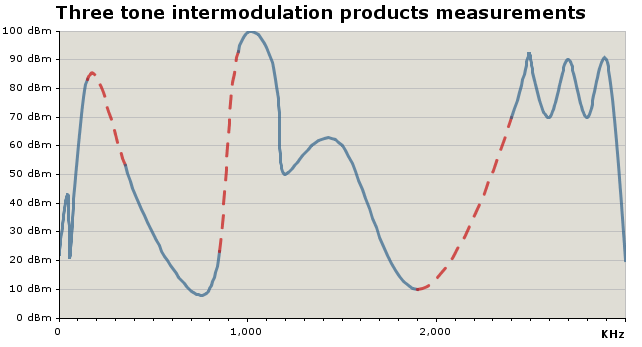
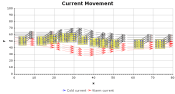
Let's say you have made changes to your manufacturing process and would like to see whether it bounds to expected value ranges. MonarchCharts gives you the appropriate visuals to easily fulfil your needs.Got real-time data coming?
The MonarchCharts has an ability to automatically refresh itself when the underlying data source changes. Using our event based data model you will be able to see the real time data on your charts.Combination charts
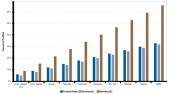
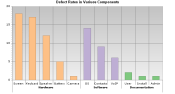
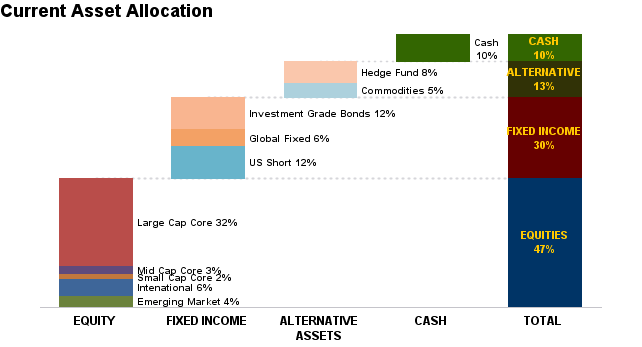
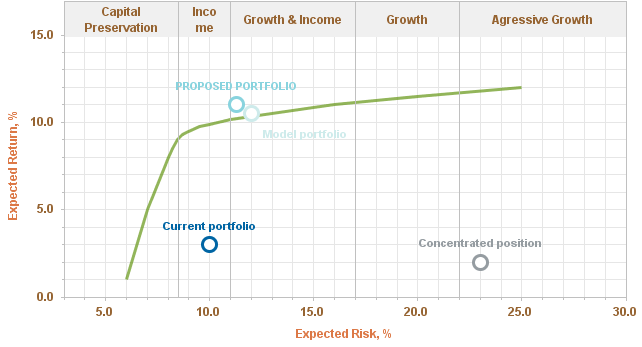
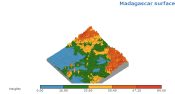
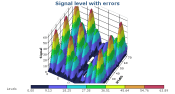
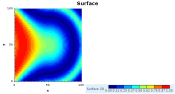
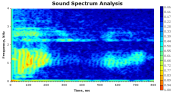
Need to compare the data from several sources? You can have several graphs inside a single chart - just add new series to already created chart. Combine line, scatter, bars, stock symbols together.Practical visuals
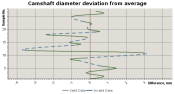
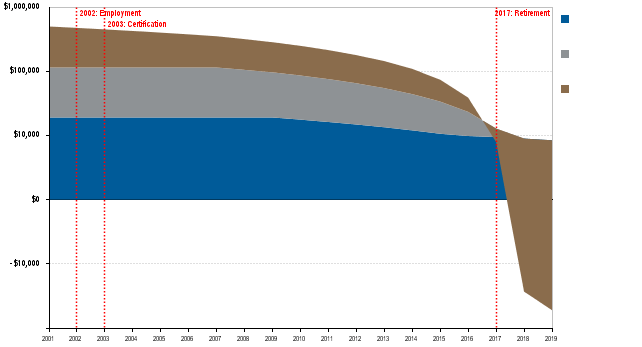
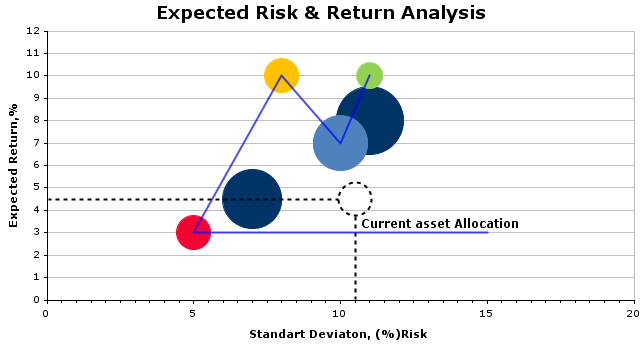
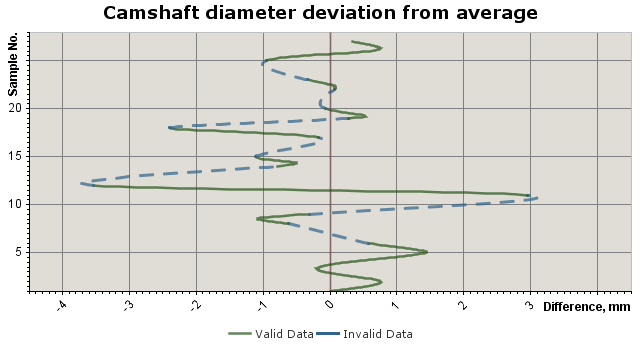
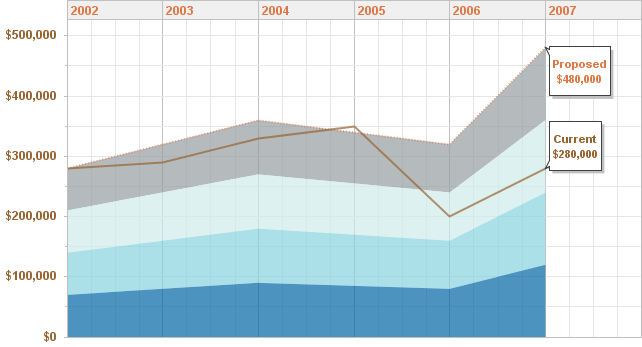
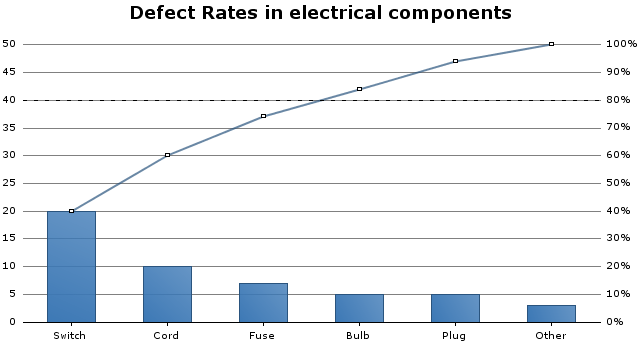
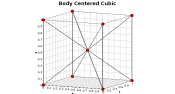
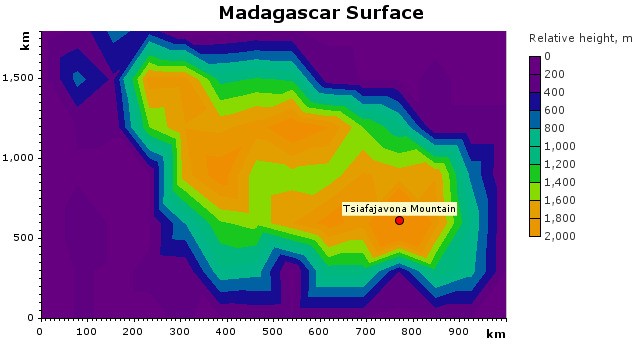
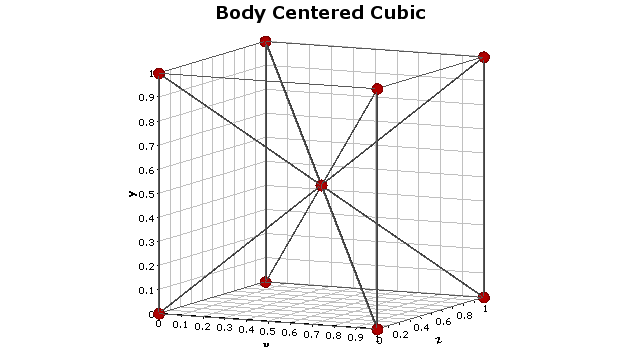
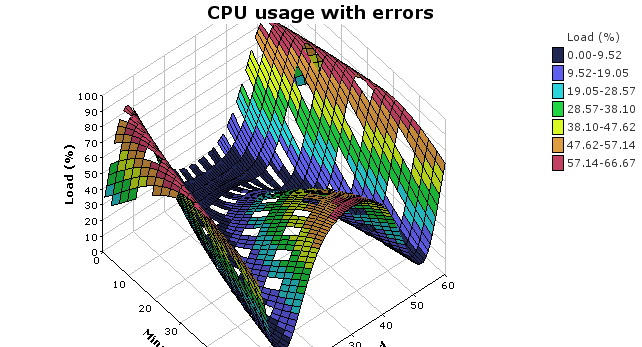
Correct charts always emphasize certain aspects - whether it's a sales difference from previous year, multiple particle positions in a 3D chart or a measurement deviation range on axis. Use different rendering styles to show the important details and grey out the unnecessary parts.Right explanations
Graphs should be self-explanatory: viewer should understand a chart without referring to additional information from outside. With MonarchCharts labels, balloon markers, tool-tips, you will answer the viewer questions like:- what does this curve show?
- what are the measurement units?
- where exactly are we in our data range?
- what is my zoom level?
No information overload
All chart information can be made visible only when necessary - hide minor tick values, use tool-tips or display labels only when user selects a Legend entry.Active and user-friendly
Great-looking charts invite your user to interact with them. Use zoom and scroll features, add scrollbars and scroll markers to axis, use zoom rectangle, rotate and scroll through 3D charts. Use series, points and Legend based selection, hook your own drill-down actions on chart elements.Locale-aware
You must always get the right date and numeric formats depending in the currently set Locale, whether in a browser or standalone application. Whether you use Chinese, Japanese or other asian languages, your charts will always be compliant with i18n standard.Conversions-capable
Need to display data in different measurement units? Miles to km's, imperial to metric values can be easily converted using MonarchCharts formula function - just pass the formula and set the units on axis.Technical notes
- MonarchCharts requires Sun JDK 1.5 or later.
- Java Server Faces 1.1 or later is recommended for Web applications.
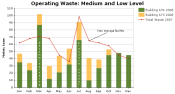
Statistical Process Control


Manufacturing


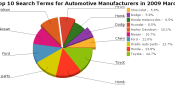
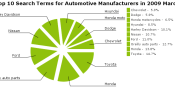
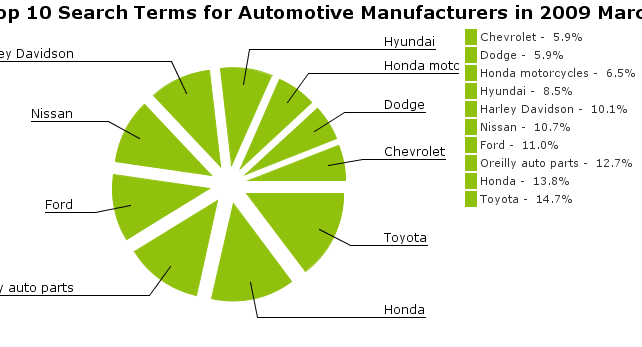
Automotive


gallery "Geopolitics" does not exist
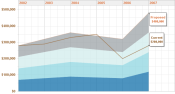
gallery "Financial" does not exist
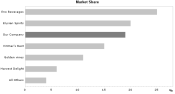
gallery "Marketing" does not exist
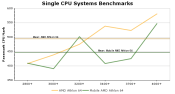
gallery "Benchmarks" does not exist
gallery "Retail" does not exist
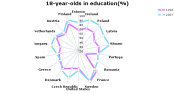
gallery "Statistics" does not exist
gallery "Physics" does not exist
gallery "Economics" does not exist
gallery "Security" does not exist
gallery "Engineering" does not exist
gallery "Investment" does not exist